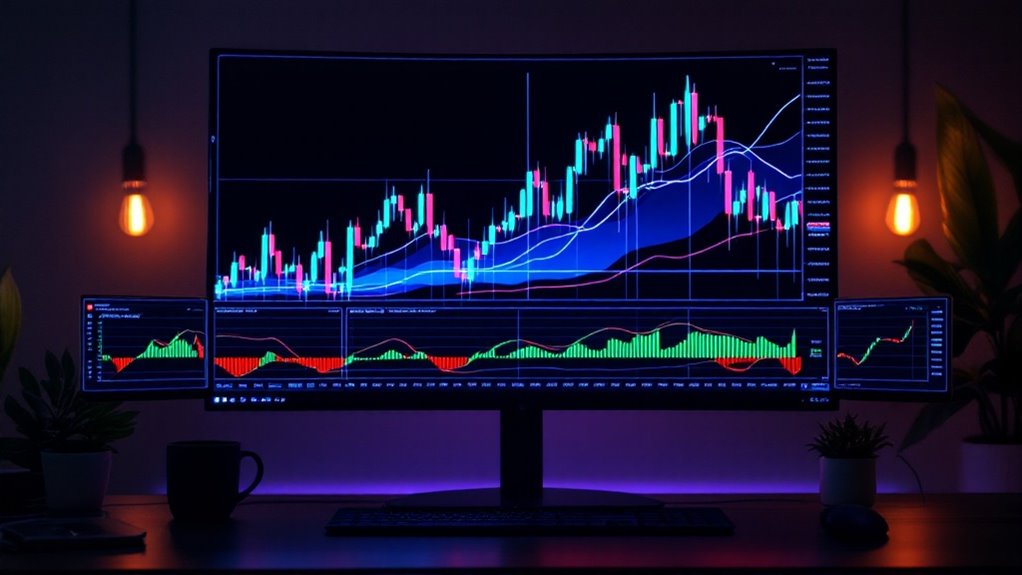
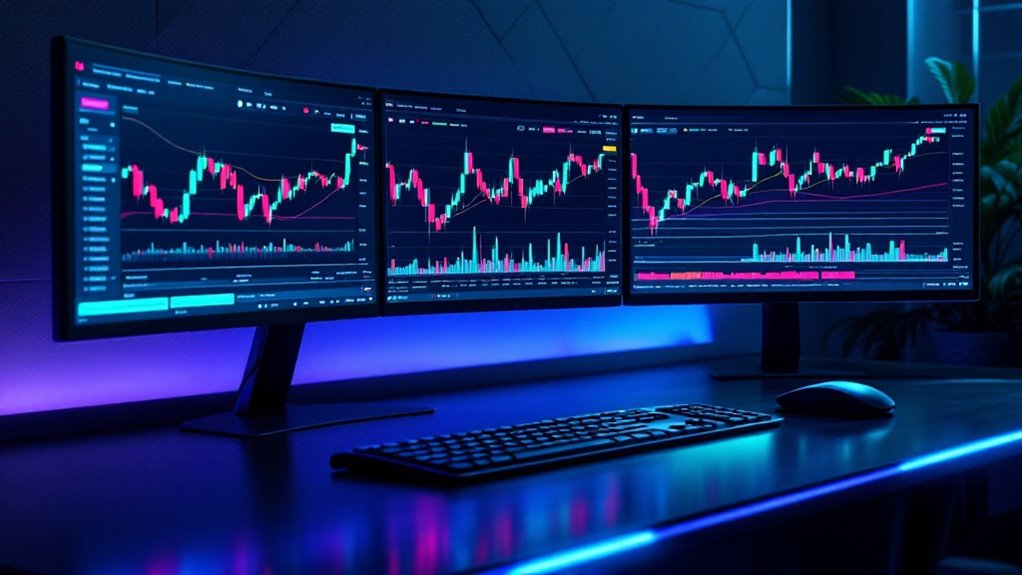
Reading crypto charts requires understanding multiple technical indicators and time frames to decode market psychology. Traders analyze candlestick patterns, moving averages, and volume data while watching for key formations like head and shoulders or double bottoms. Support and resistance levels act as invisible boundaries, while tools like Bollinger Bands help gauge volatility. Though no indicator guarantees success, mastering chart analysis empowers traders to navigate the crypto market's turbulent waters with greater confidence.

While traditional investors once relied solely on stock market charts, the rise of cryptocurrency trading has introduced a whole new world of technical analysis tools and patterns. Like skilled artists interpreting abstract paintings, traders must learn to decode the stories hidden within these digital canvases of price action. At the heart of crypto charting lies the candlestick, those mesmerizing blocks of green and red that dance across screens worldwide, each one telling its own tale of market psychology. Understanding these patterns is crucial since crypto markets exhibit higher volatility compared to traditional stocks.
The basic building blocks begin with time frames, those windows into market behavior that can span mere minutes or stretch across months. Traders paint their analysis across this temporal canvas, layering on indicators like master artists adding depth to their work. Moving averages flow like rivers through the chart, while the RSI oscillates between extremes like a pendulum marking the market's emotional state. Point and figure charts offer another analytical perspective for experienced traders.
Bollinger Bands expand and contract like a breathing organism, reflecting the market's changing volatility. Pattern recognition becomes second nature to experienced chart readers. They spot head and shoulders formations that signal potential reversals, like mountain ranges emerging from market noise. Double tops and bottoms stand like sentinels marking territory where buyers and sellers have previously battled. Market sentiment plays a crucial role in shaping these patterns and determining their reliability.
Support and resistance levels create invisible floors and ceilings that traders watch with hawk-like attention. Volume bars rise and fall beneath price action like the foundation of a building, providing vital context for every market move. When price and volume tell different stories, seasoned traders pause to reflect on the divergence.
Technical indicators stack atop one another like layers of geological strata, each adding its own perspective to the market's story. The art of reading crypto charts requires patience, practice, and a healthy respect for uncertainty. While no indicator or pattern can predict the future with certainty, they provide valuable context for decision-making in these volatile digital markets.
As the crypto landscape continues to evolve, chart reading remains an essential skill for maneuvering its unpredictable waters.
Frequently Asked Questions
What Tools Can I Use to Practice Reading Crypto Charts?
Several tools are available for practicing crypto chart reading, including TradingView's demo accounts, Binance's paper trading, and educational platforms like Investopedia. Mobile apps like TabTrader and Delta also offer practice opportunities.
How Often Should I Check Cryptocurrency Charts During Active Trading?
Chart checking frequency depends on one's trading strategy. Day traders monitor every few minutes, swing traders check several times daily, while position traders review weekly. Setting specific check times helps maintain disciplined trading.
Can Artificial Intelligence Help Interpret Crypto Chart Patterns Accurately?
AI can effectively detect and interpret crypto chart patterns through advanced algorithms and machine learning. It offers faster analysis and higher accuracy than human traders, though oversight remains important to validate AI-generated signals.
Which Timeframes Are Most Reliable for Cryptocurrency Chart Analysis?
Multiple timeframes offer the most reliable cryptocurrency analysis. Long-term frames reveal major trends, while medium-term (1-4 hours) provides balanced insights. Combining timeframes in 1:4 or 1:6 ratios enhances analytical accuracy.
Should I Combine Multiple Chart Types When Analyzing a Cryptocurrency?
Combining multiple chart types is highly recommended for thorough analysis. Line charts show trends, candlesticks reveal detailed price action, and bar charts with volume provide confirmation of market movements and potential reversals.


